
Notice
Recent Posts
Recent Comments
Link
| 일 | 월 | 화 | 수 | 목 | 금 | 토 |
|---|---|---|---|---|---|---|
| 1 | 2 | 3 | 4 | |||
| 5 | 6 | 7 | 8 | 9 | 10 | 11 |
| 12 | 13 | 14 | 15 | 16 | 17 | 18 |
| 19 | 20 | 21 | 22 | 23 | 24 | 25 |
| 26 | 27 | 28 | 29 | 30 | 31 |
Tags
- 비행기 추락
- 비선형성
- 자기관리
- 이기적 유전자
- R 기초
- 찬물샤워
- 산입범위
- 최저 시급
- 유닛테스트
- 핵 개발
- t-test
- 성악설
- 동전 던지기
- 티모시페리스
- 아인슈타인
- 조던피더슨
- 통계오류
- R 프로그래밍
- 선형성
- 통계 오류
- R4DS
- 수학적 사고
- 핵개발
- t검정
- 최저시급 개정안
- 멘탈관리
- 인터스텔라
- 큰수의 법칙
- 산입 범위
- 비율
Archives
- Today
- Total
public bigdata
[datacamp] Building Web Application with Shiny in R 본문
Part1
1. Parts of Shiny app
library(shiny)

ui <- fluidPage()

server <- function(input,
				   output,
                   session){
                   }

shinyApp(ui = ui, server = server)- Load shiny
- Create the UI with a HTML function
- Define a custom function to create the server
- Run the app
간단한 예제 하나
library(shiny)

ui <- fluidPage(
  "Hello, world!!!"
)
server <- function(input, output, session){

}

shinyApp(ui = ui, server = server)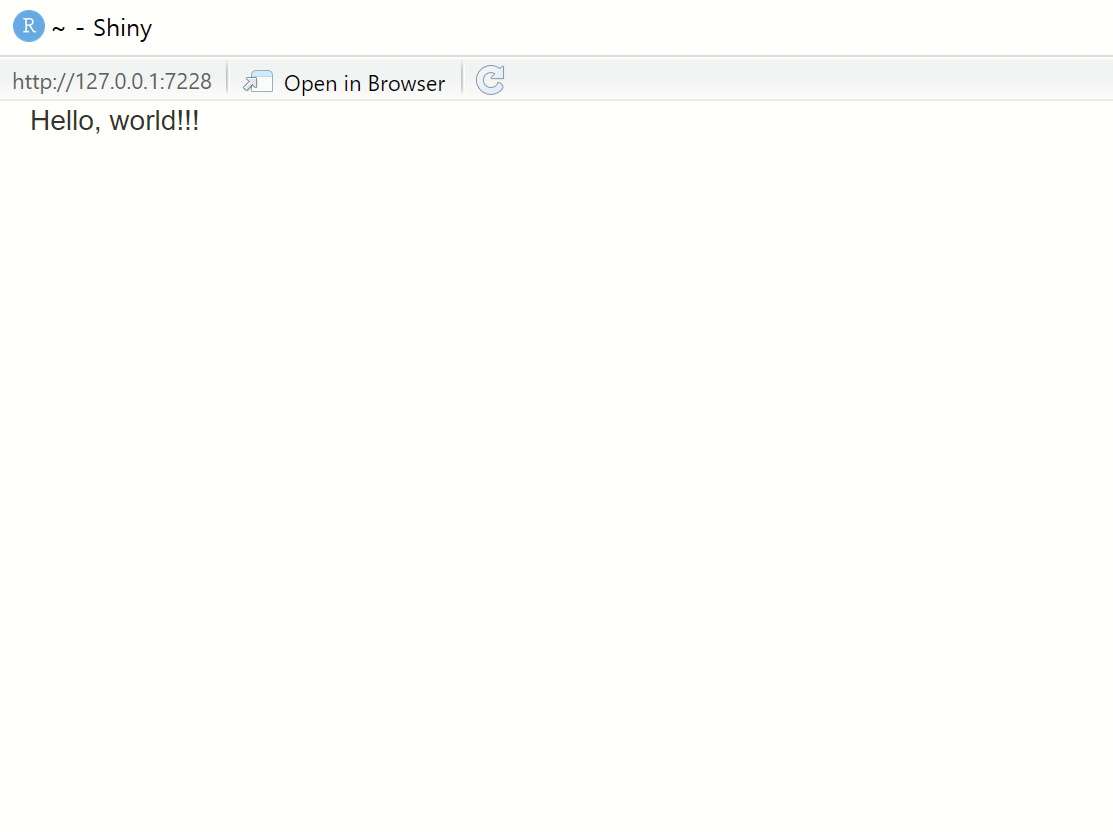
2. Ask a question(with an input!)
library(shiny)

ui <- fluidPage(
  textInput(inputId = "name", label = "Enter a name : "),
  textOutput("q")
)

server <- function(input, output){
  output$q <- renderText({
    paste("Do you prefer dogs or cats, ", input$name, "?")
  })
}

shinyApp(ui=ui, server = server)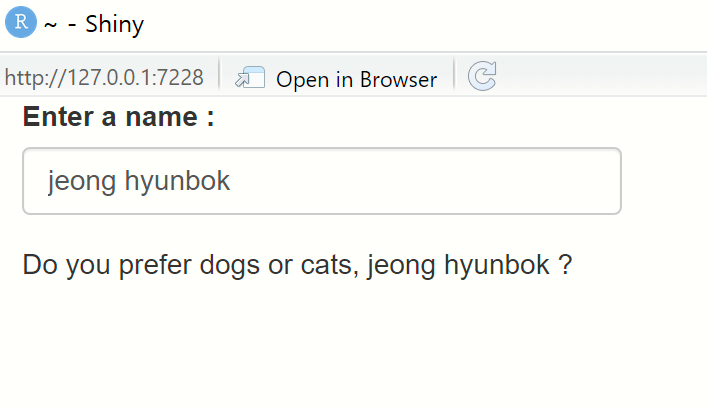
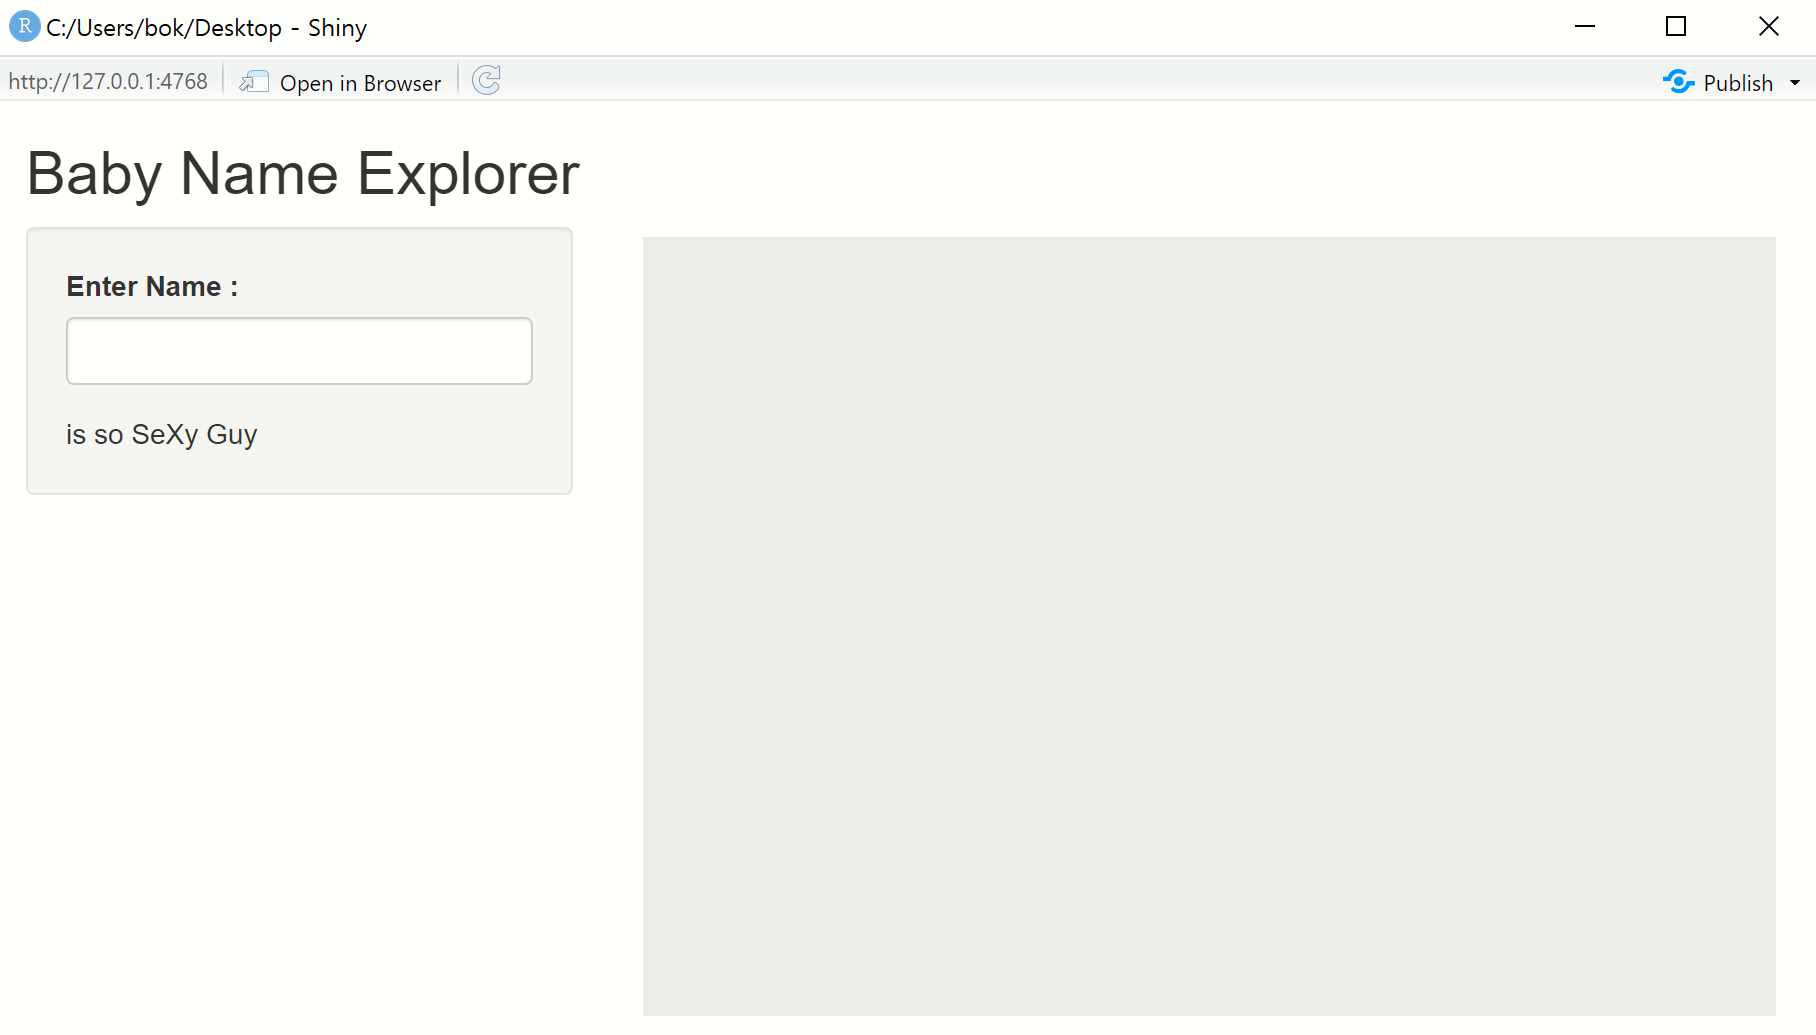
3. Building a babynames explorer Shiny app
library(shiny)
library(tidyverse)

ui <- fluidPage(
  titlePanel("Baby Name Explorer"),
  sidebarLayout(
    sidebarPanel(
      textInput('name', 'Enter Name :'),
      textOutput('textoutput1')
    ),
    mainPanel({
      plotOutput('trend')
    })
  )
)

server <- function(input, output, session){
  output$textoutput1 <- renderText({
    paste0(input$name, ' is so SeXy Guy')
  })
  output$trend <- renderPlot({
    ggplot()
  })
}

shinyApp(ui=ui, server = server)
sidebarLayout이 있기 때문에 아래처럼 titlePanel 및에 sidebarPanel, mainPanel이 좌우로 배치된다.
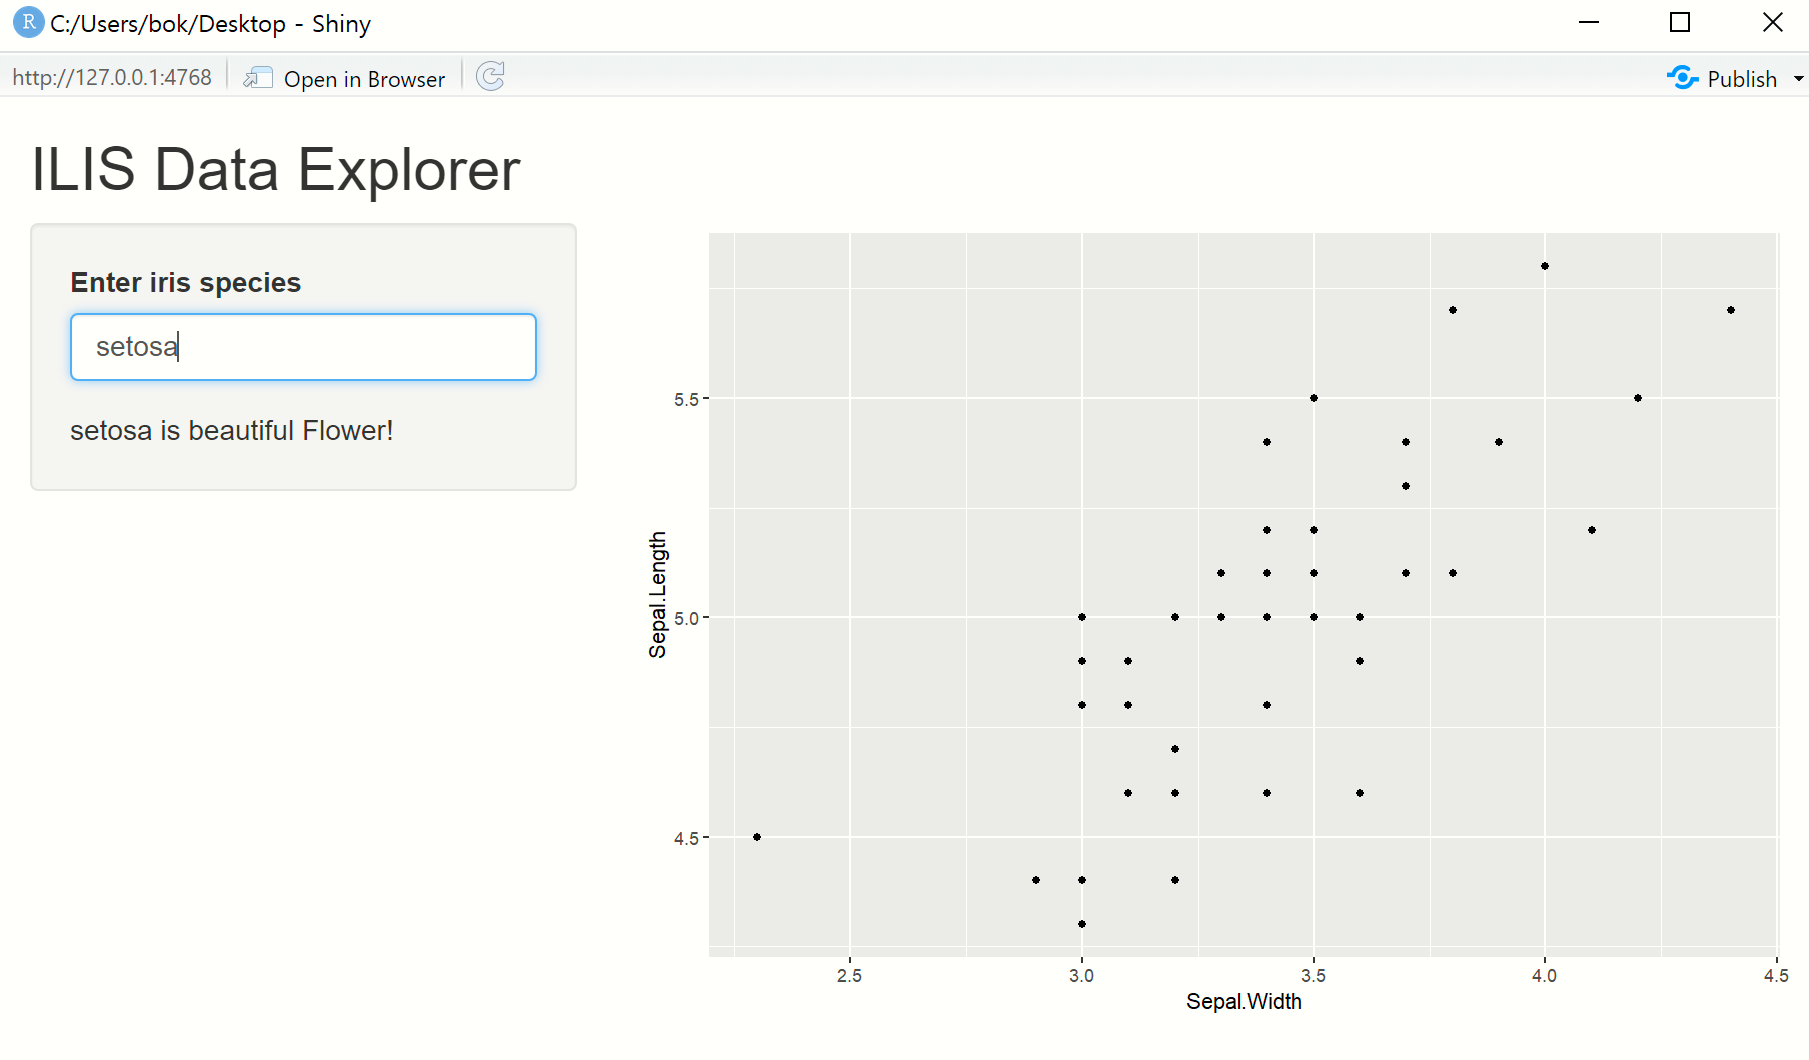
위 예제에서 조금 변형하여 iris 데이터의 Species를 입력하면, 해당하는 아이리스 꽃의 Sepal 정보가 plot 되도록 구성해 보았다.
library(shiny)
library(tidyverse)

ui <- fluidPage(
  titlePanel("ILIS Data Explorer"),
  sidebarLayout(
    sidebarPanel(
      textInput('species', 'Enter iris species'),
      textOutput('textoutput1')
    ),
    mainPanel({
      plotOutput('trend')
    })
  )
)

server <- function(input, output, session){
  output$textoutput1 <- renderText({
    paste0(input$species, ' is beautiful Flower!')
  })
  output$trend <- renderPlot({
    iris_data <- iris %>% filter(Species==input$species)
    ggplot(iris_data) +
      geom_point(aes(Sepal.Width, Sepal.Length))
  })
}
part2
1. Where to use inputs
library(shiny)
library(tidyverse)


help("checkboxInput")

ui <- fluidPage(
  textInput('name', 'Enter a name:'),
  selectInput('animal', 'Dogs or cats?', choices = c("dogs", "cats")),
  textOutput("greeting"),
  textOutput('answer')
)

server <- function(input, output, session){
  output$greeting <- renderText({
    paste('Do you prefer dogs or cats, ', input$name, "?")
  })
  output$answer <- renderText({
    paste('I prefer', input$animal, "!")
  })

}
shinyApp(ui = ui, server = server)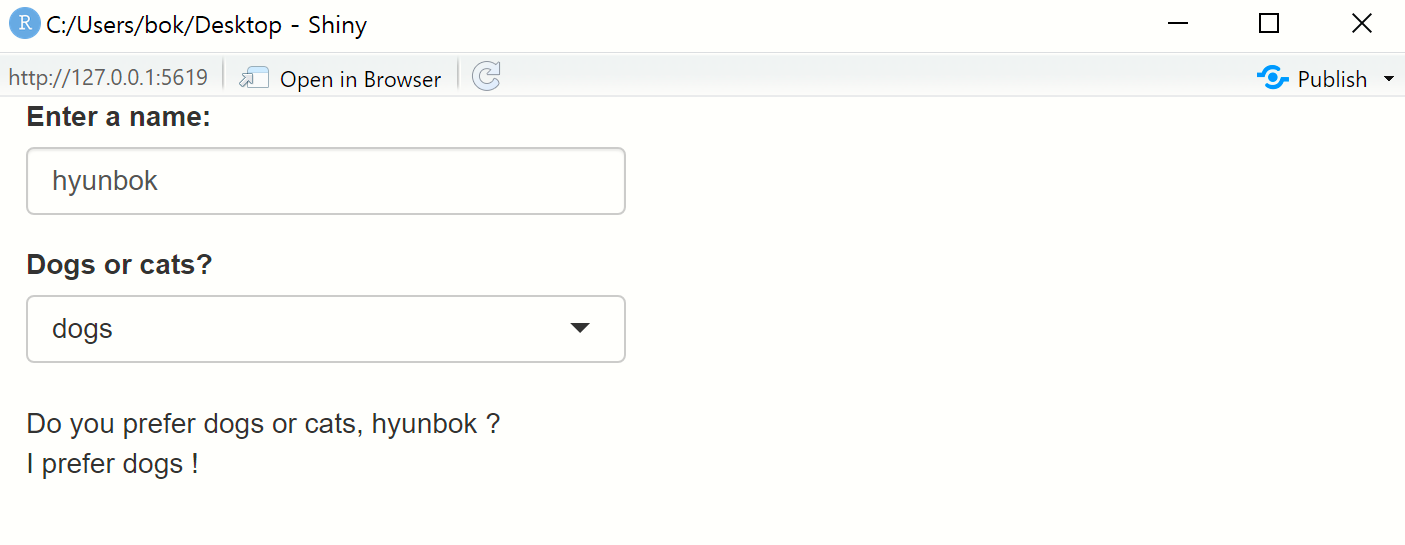
2. Other render functions
- renderTable()
- renderImage()
- renderPlot()
3. Other output functions
- tableOutput() or dataTableOutput
- imageOutput()
- plotOutput()
4. Non-shiny output and render functions
library(shiny)
library(tidyverse)


ui <- fluidPage(
  DT::DTOutput('babynames_table')
)

server <- function(input, output, session){
  output$babynames_table <- DT::renderDT({
    iris
  })
}

shinyApp(ui=ui, server = server)
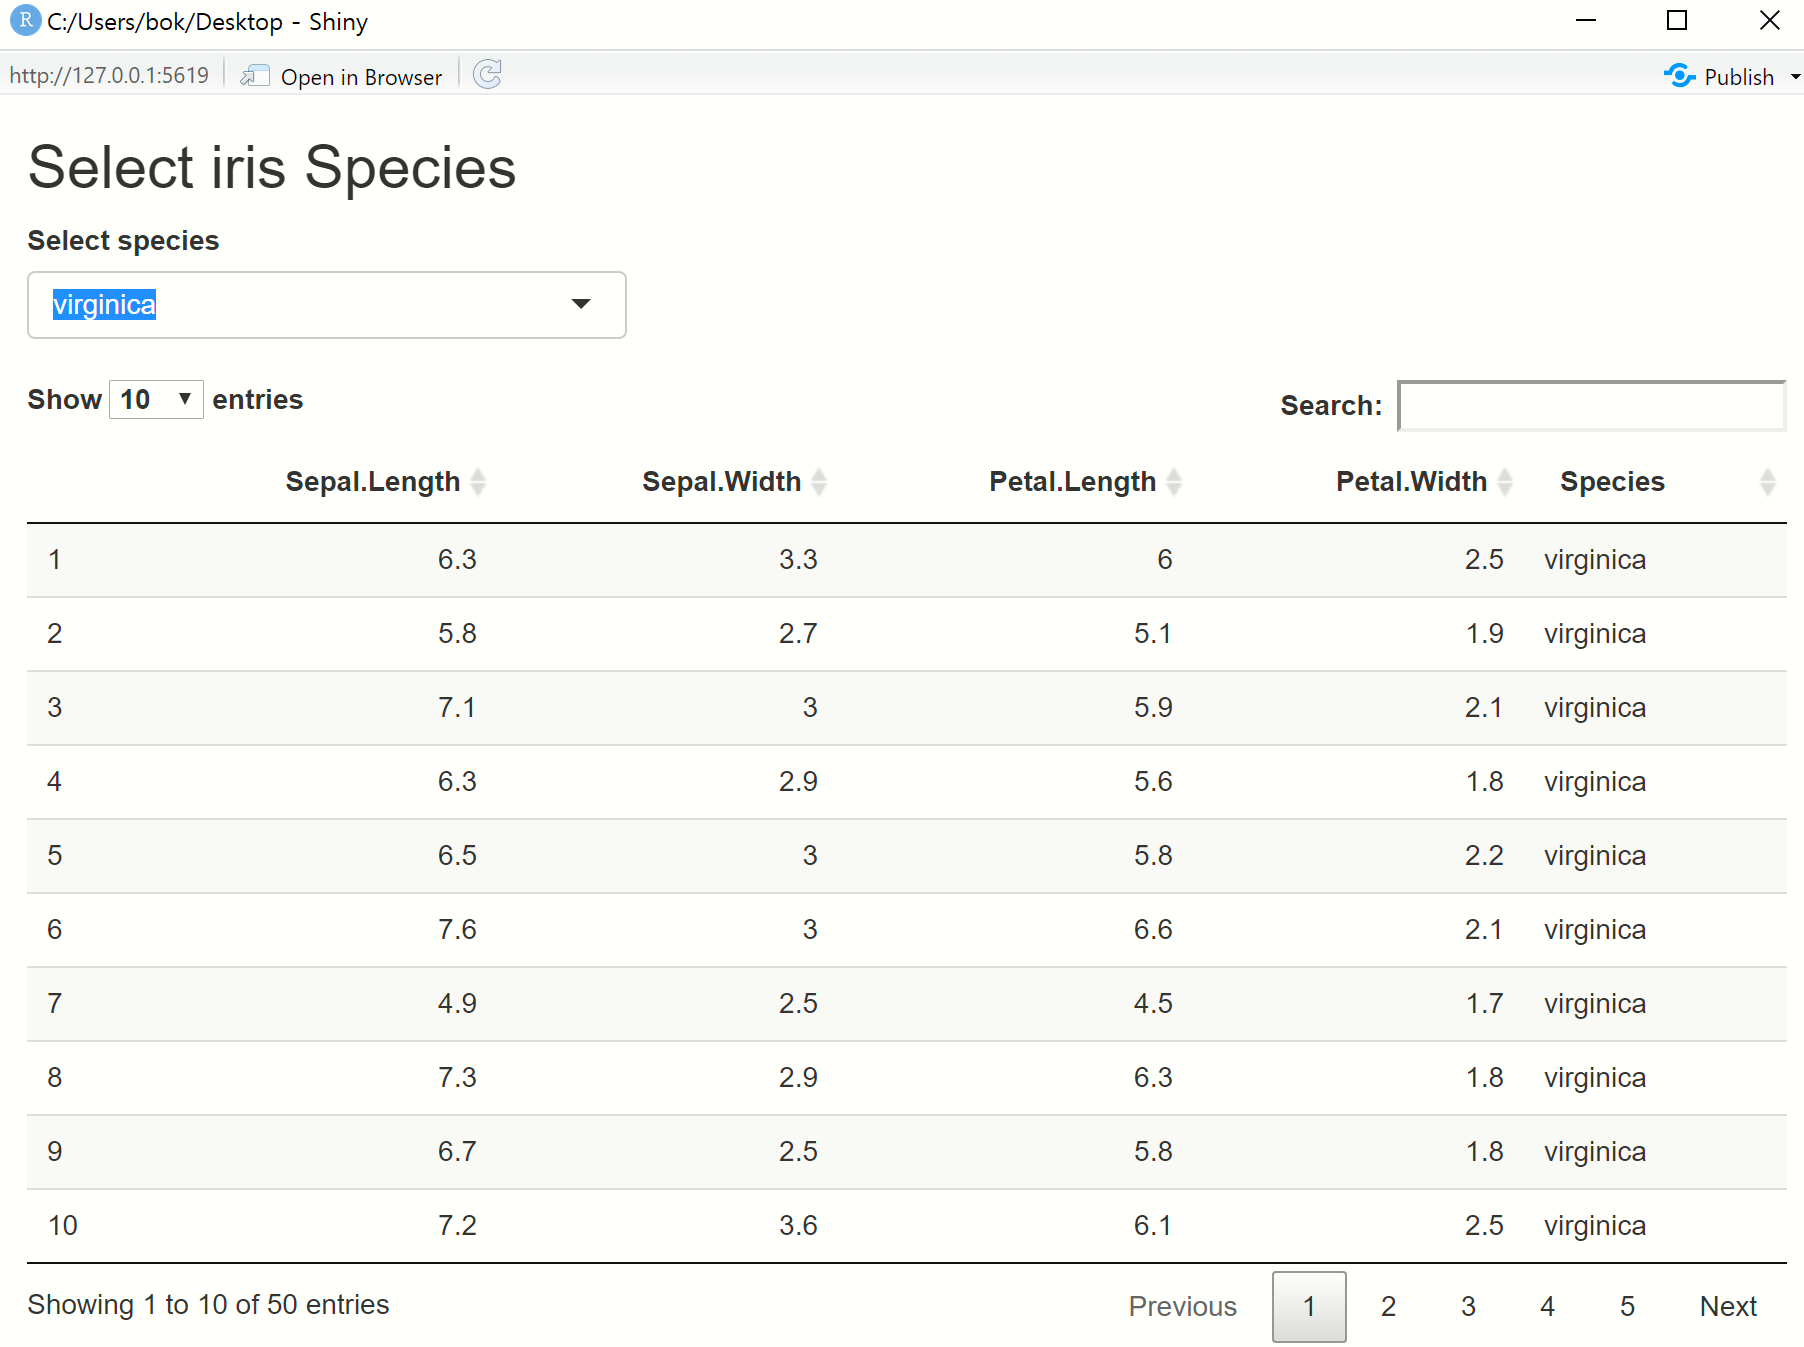
4. Non-shiny output and render functions - Example
library(shiny)
library(tidyverse)


ui <- fluidPage(
  titlePanel("Select iris Species"),
  selectInput('species', 'Select species', choices = c("setosa", "versicolor", "virginica")),
  # CODE BELOW: Add table output named "table_top_10_names"
  DT::DTOutput('table_top_10_iris')
)

server <- function(input, output, session){
  # Function to create a data frame of top 10 names by sex and year
  top_10_iris <- function(){
    top_10_iris <- iris %>%
      filter(Species == input$species)
  }
  # CODE BELOW: Render a table output named "table_top_10_names"
  output$table_top_10_iris <-DT::renderDT({
    top_10_iris()
  })
}
shinyApp(ui = ui, server = server)
plotly 함수를 이용한 output도 가능하다.
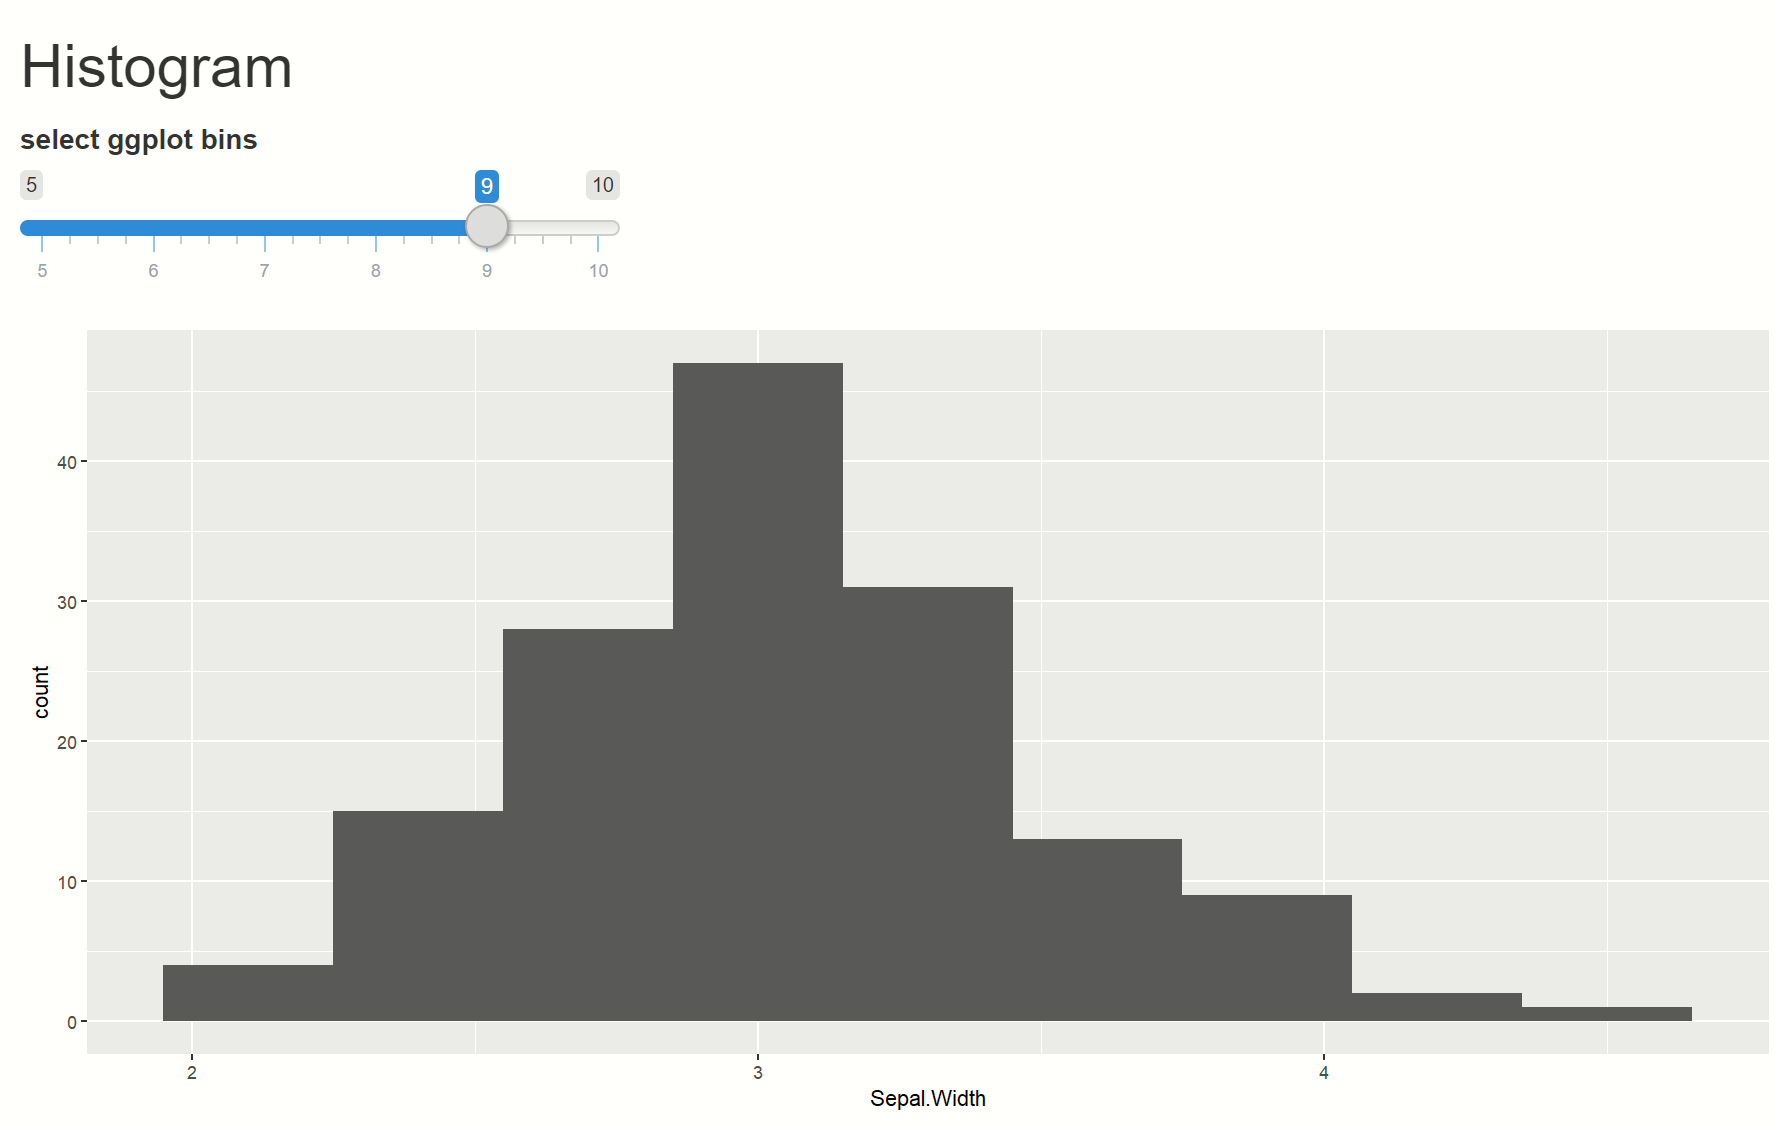
5. Default Shiny app layout
library(shiny)
library(tidyverse)

ui <- fluidPage(
  titlePanel('Histogram'),
  sliderInput('nb_bins', 'select ggplot bins', 5, 10, 5),
  plotOutput('hist')
)

server <- function(input, output, session){
  output$hist <- renderPlot({
    ggplot(iris, aes(x = Sepal.Width))+
      geom_histogram(bins = input$nb_bins)
  })
}

shinyApp(ui = ui, server = server)
6. Sidebar layout
library(shiny)
library(tidyverse)

ui <- fluidPage(
  titlePanel('Histogram'),
  sidebarLayout(
    sidebarPanel(sliderInput('nb_bins', 'select ggplot bins', 5, 10, 5)),
    mainPanel(plotOutput('hist'))
  )
)

server <- function(input, output, session){
  output$hist <- renderPlot({
    ggplot(iris, aes(x = Sepal.Width))+
      geom_histogram(bins = input$nb_bins)
  })
}

shinyApp(ui = ui, server = server)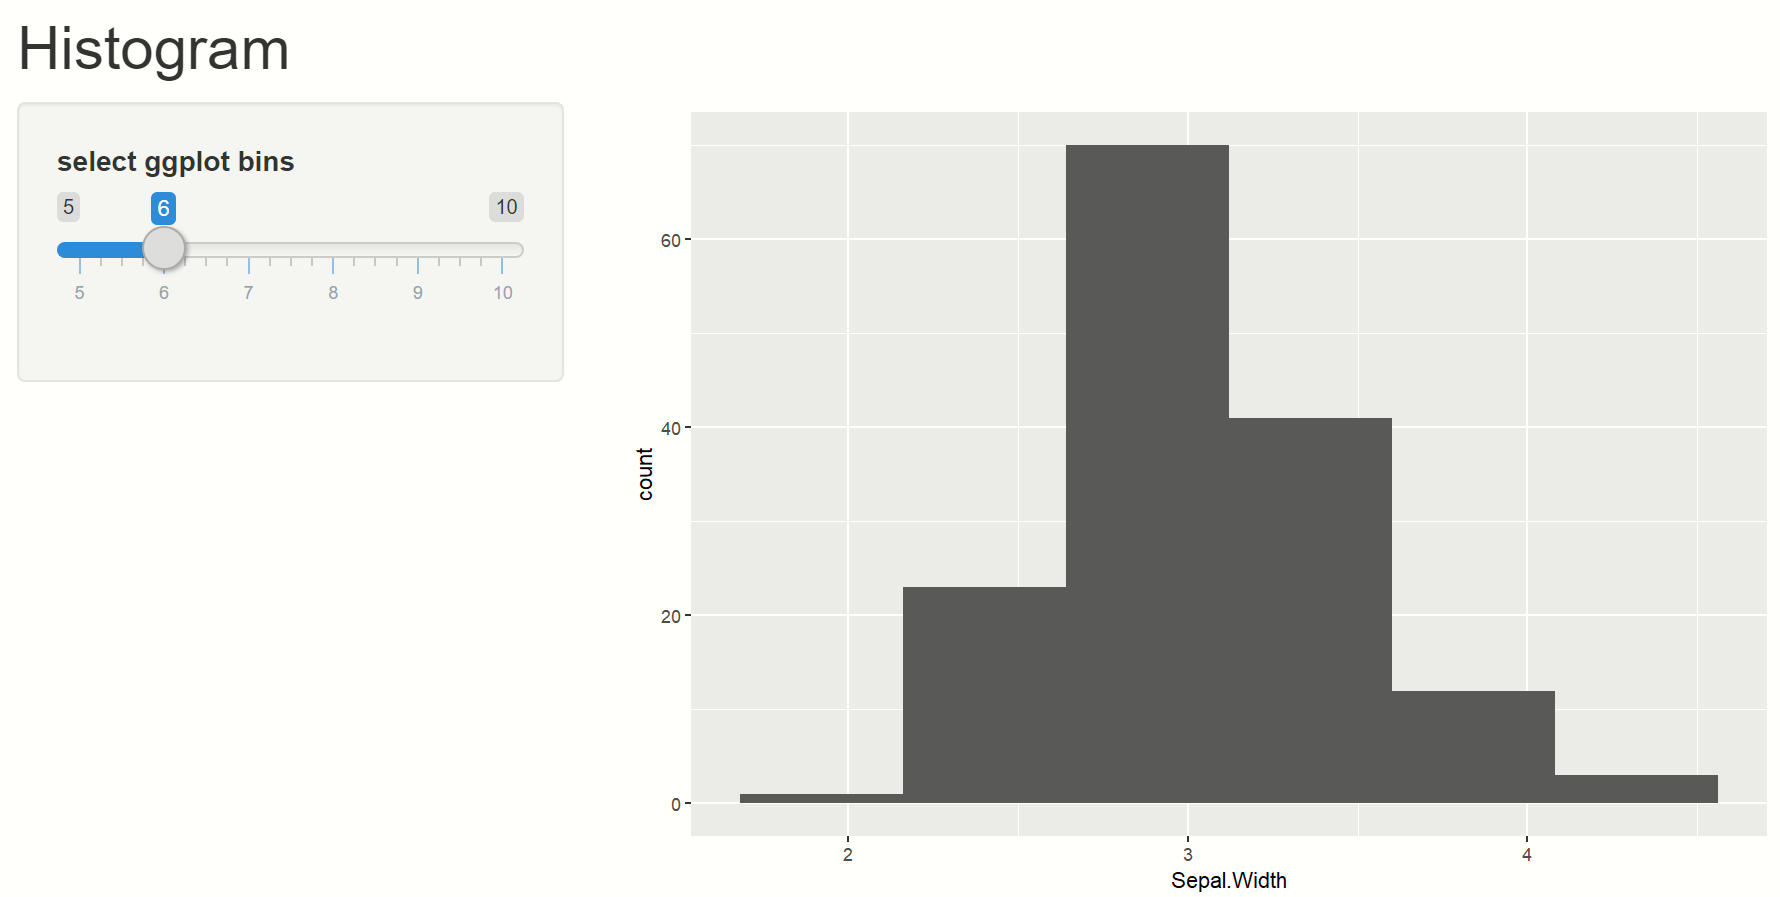
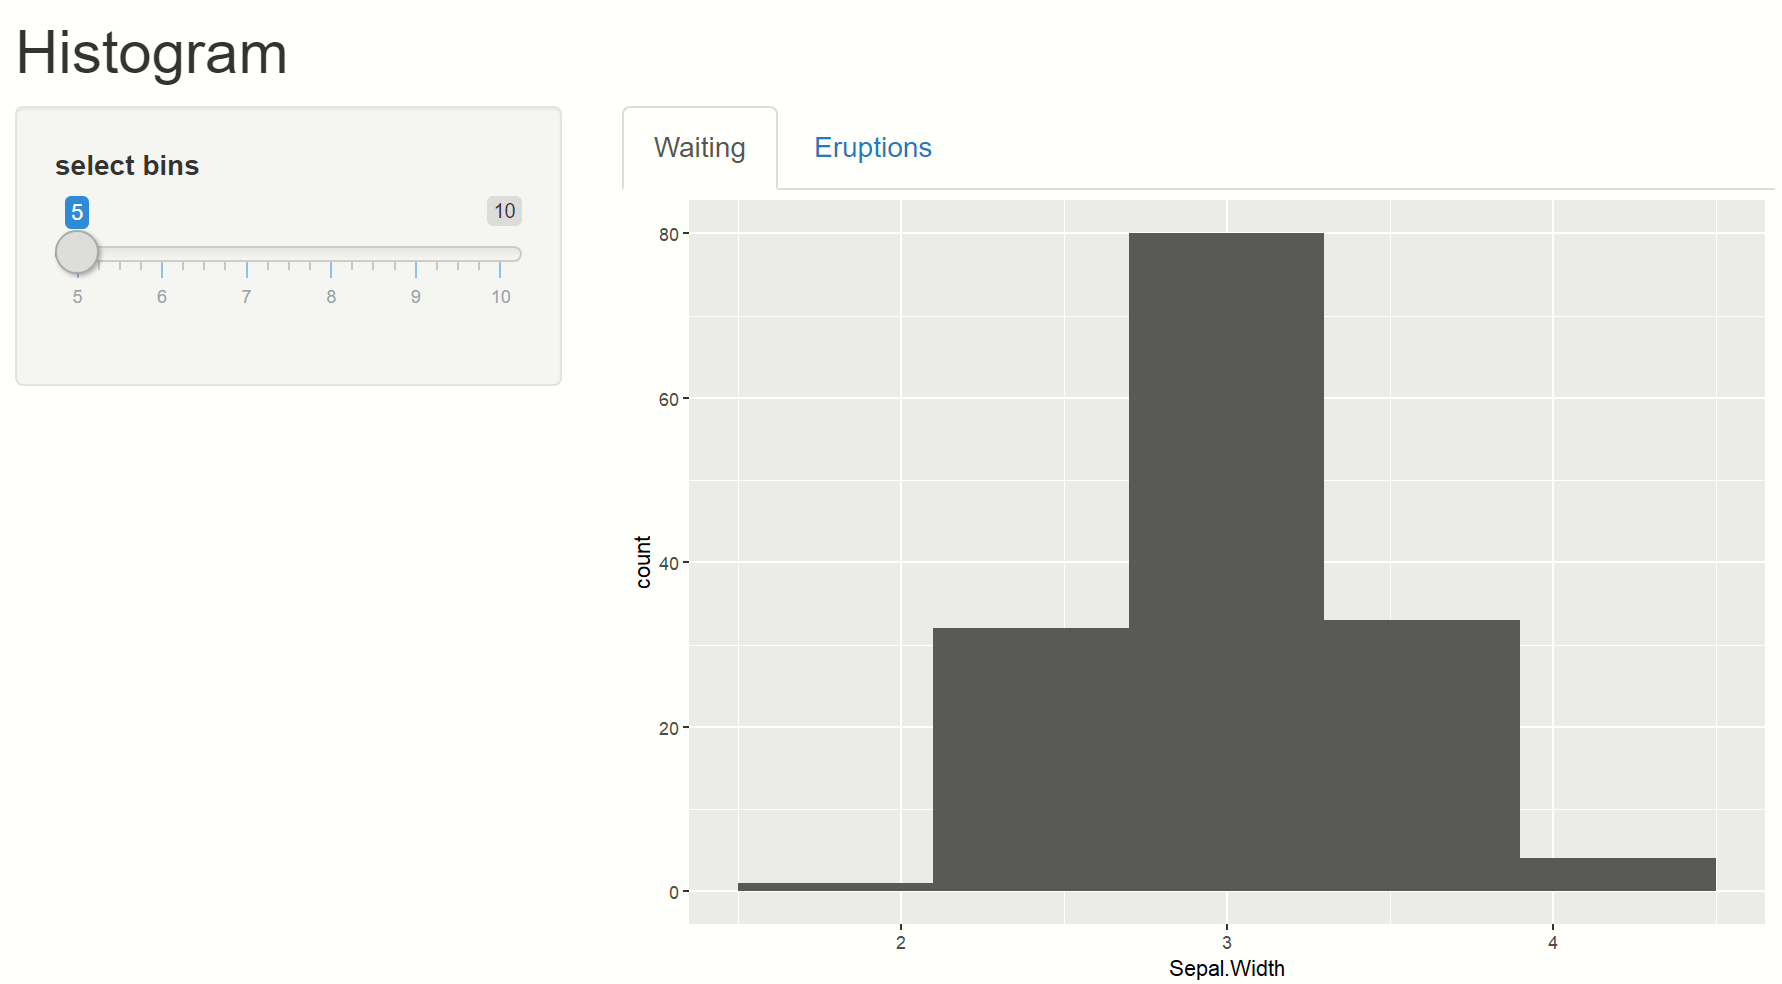
7. Tab layout
library(shiny)
library(tidyverse)

ui <- fluidPage(
  titlePanel("Histogram"),
  sidebarLayout(
    sidebarPanel(sliderInput('nb_bins', 'select bins', 5, 10, 5)),
    mainPanel(
      tabsetPanel(
        tabPanel('Waiting',
                 plotOutput('Wating_plot')),
        tabPanel('Eruptions',
                 plotOutput('Eruption_plot'))
      )
    )
  )
)

server <- function(input, output, session){
  output$Wating_plot <- renderPlot({
    ggplot(iris, aes(Sepal.Width))+
      geom_histogram(bins = input$nb_bins)
  })
  output$Eruption_plot <- renderPlot({
    ggplot(iris, aes(Petal.Width))+
      geom_histogram(bins = input$nb_bins)
  })
}

shinyApp(ui = ui, server = server)
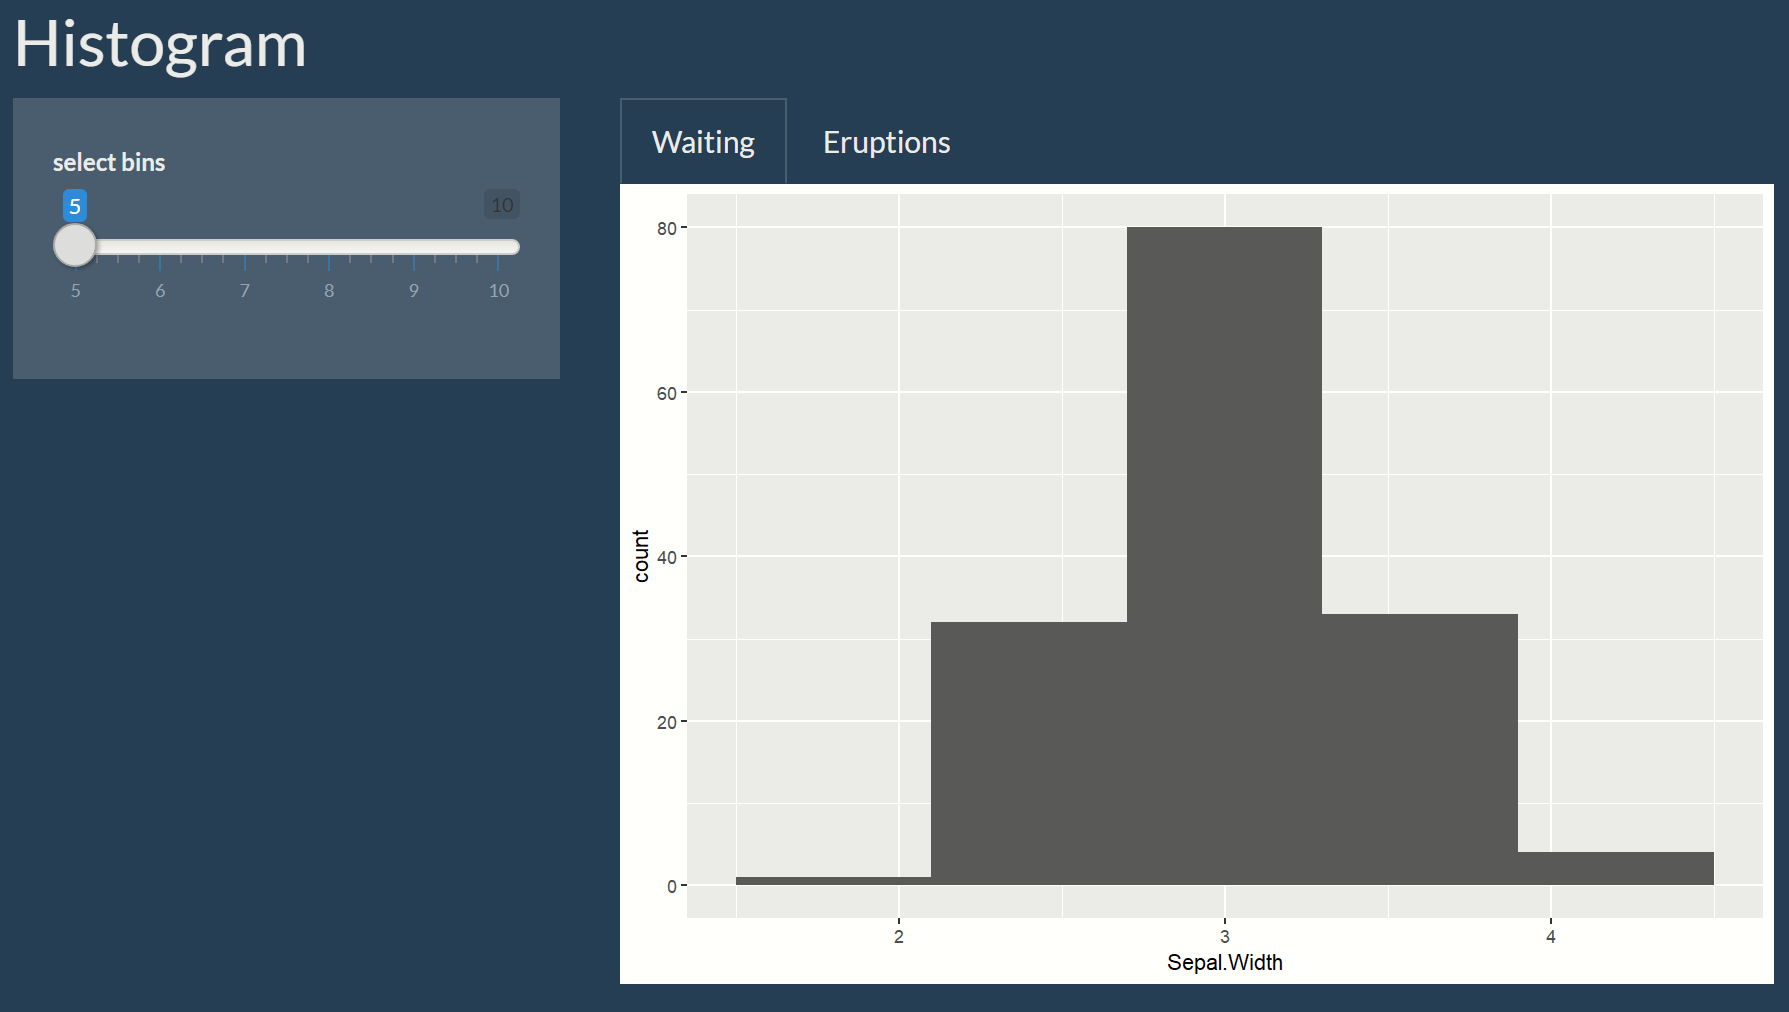
8. Theme selector
library(shiny)
library(tidyverse)
library(shinythemes)
ui <- fluidPage(
  titlePanel("Histogram"),
  shinythemes::themeSelector(), # theme = shinytheme('superhero') : 이렇게도 지정 가능
  sidebarLayout(
    sidebarPanel(sliderInput('nb_bins', 'select bins', 5, 10, 5)),
    mainPanel(
      tabsetPanel(
        tabPanel('Waiting',
                 plotOutput('Wating_plot')),
        tabPanel('Eruptions',
                 plotOutput('Eruption_plot'))
      )
    )
  )
)

server <- function(input, output, session){
  output$Wating_plot <- renderPlot({
    ggplot(iris, aes(Sepal.Width))+
      geom_histogram(bins = input$nb_bins)
  })
  output$Eruption_plot <- renderPlot({
    ggplot(iris, aes(Petal.Width))+
      geom_histogram(bins = input$nb_bins)
  })
}

shinyApp(ui = ui, server = server)
9. Building Shiny apps: 4 steps
- 1. Add input(UI)
- 2. Add output(ui/Server)
- 3. Update layout(ui)
- 4. Update outputs(Server)
'R programming' 카테고리의 다른 글
| dplyr (버전업 + 몰랐던 내용 정리) (0) | 2020.03.27 |
|---|---|
| flexdashboard 참고자료 (0) | 2020.03.17 |
| [datacamp] 효율적인 R 코드 작성 (0) | 2020.03.14 |
| Machine Learning in the Tidyverse [datacamp 정리] (0) | 2020.02.24 |
| R markdown 참고자료 (0) | 2020.01.23 |
'R programming' Related Articles
more


